
Apache ECharts 6.0
Rank #1 Free Charting-library on GitHub with 20+ Chart types
What is Apache ECharts 6.0?
We’re thrilled to introduce ECharts 6.0: Redesigned for professional visuals, expanded chart types, and liberating creative freedom with more than 12 major features. Learn more at https://echarts.apache.org/handbook/en/basics/release-note/v6-feature
Pros & Cons
Pros
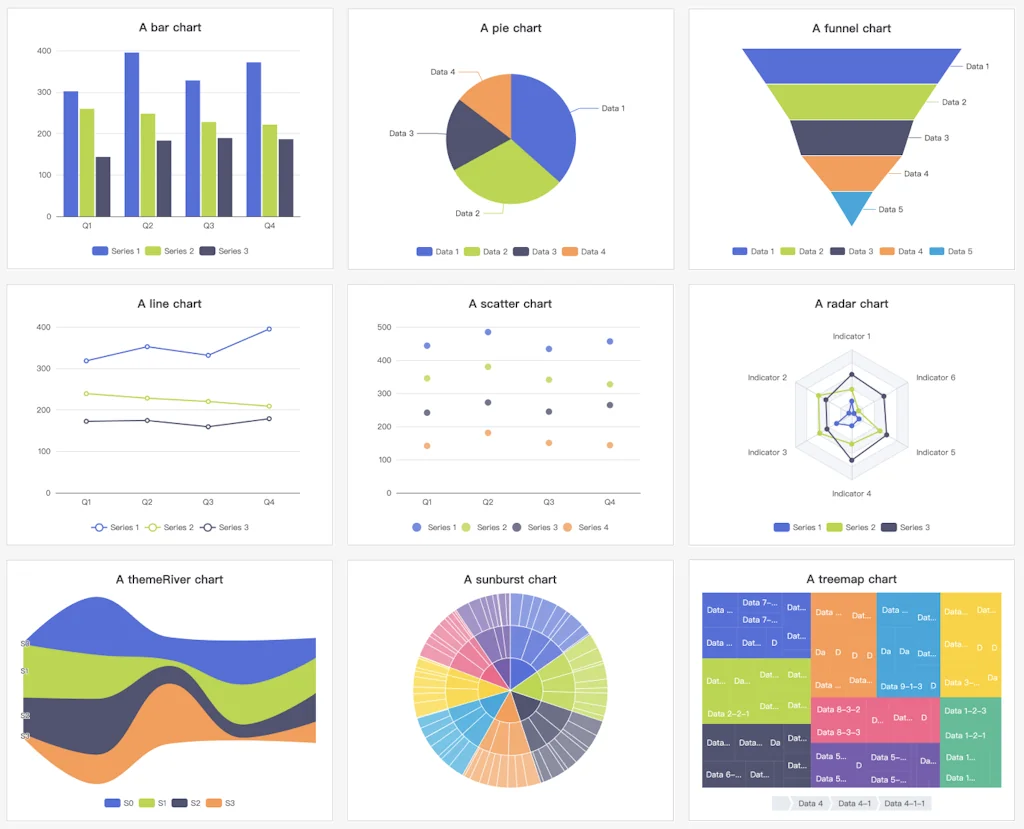
- Expanded chart types
- Professional visuals
- Community support
- Free
- Open source
- Theme color system
- AI integration
- Customization
- Excellent documentation
- Extensibility
- Feature-complete
- Matrix coordinate system
- Registerable components
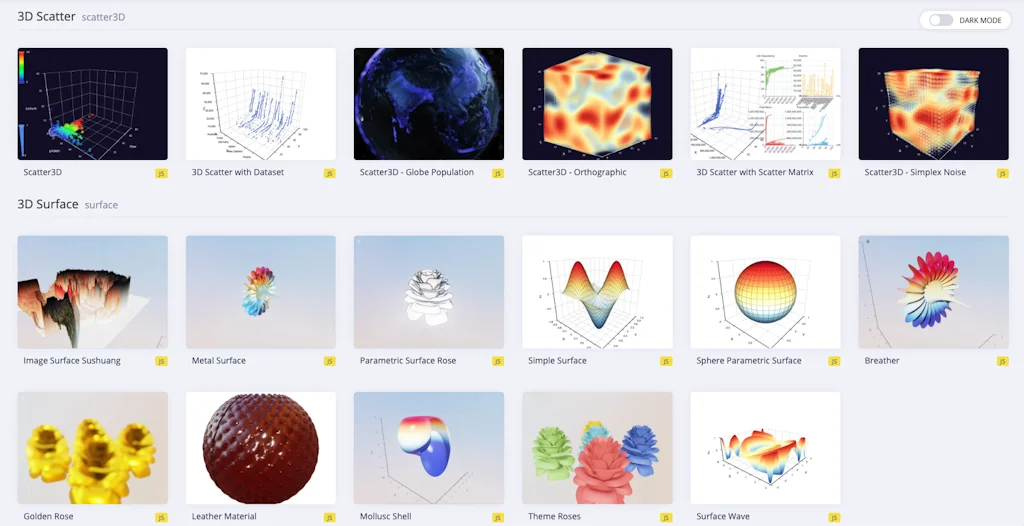
- Responsive dark mode
Cons
- Lack of native React or Vue components
Tool Details
| Categories | Engineering & Development, Data analysis tools, Data visualization tools |
|---|---|
| Website | echarts.apache.org |
| Added | August 7, 2025 |
| Platforms | Web |
| Social | Twitter · GitHub |
Recent Reviews (5)
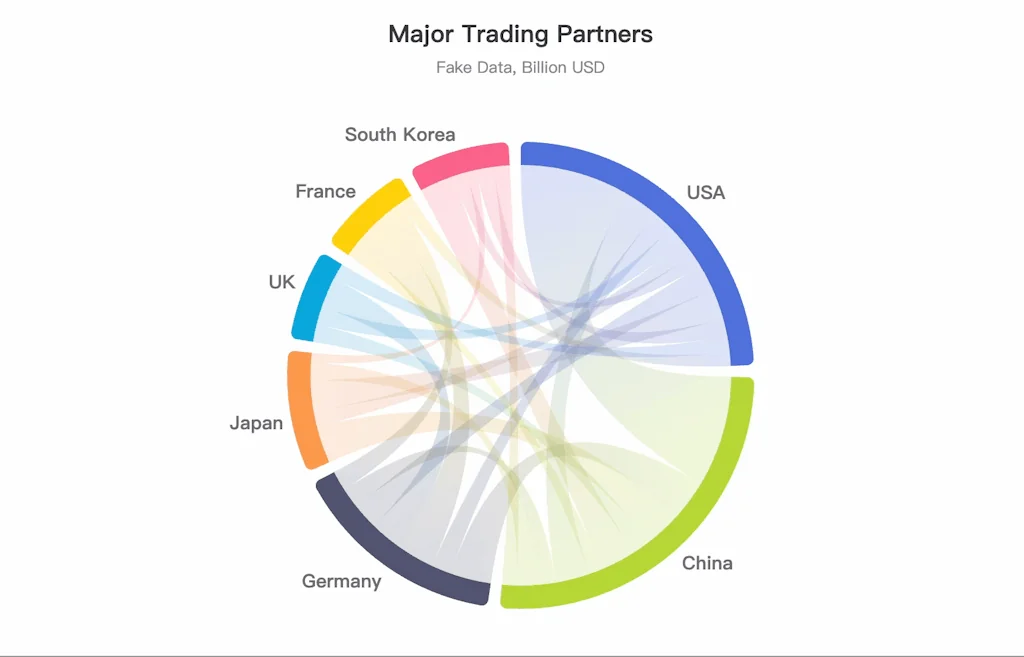
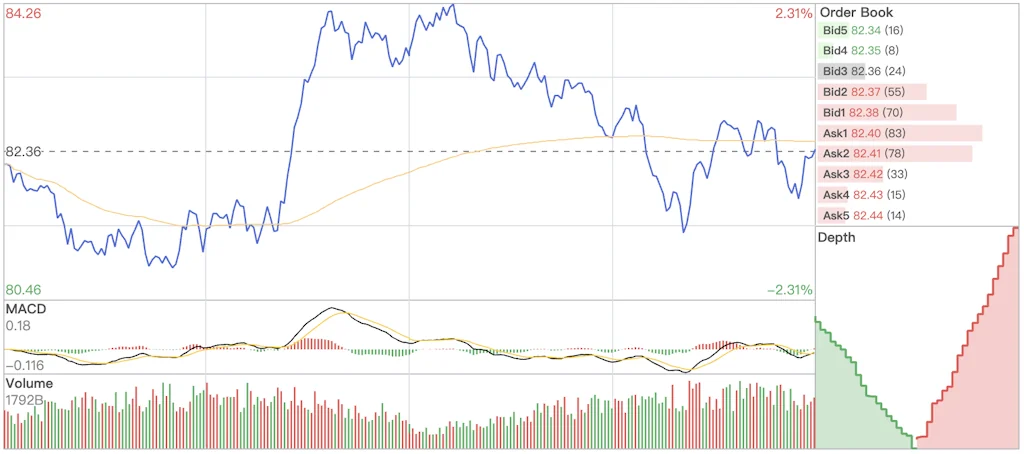
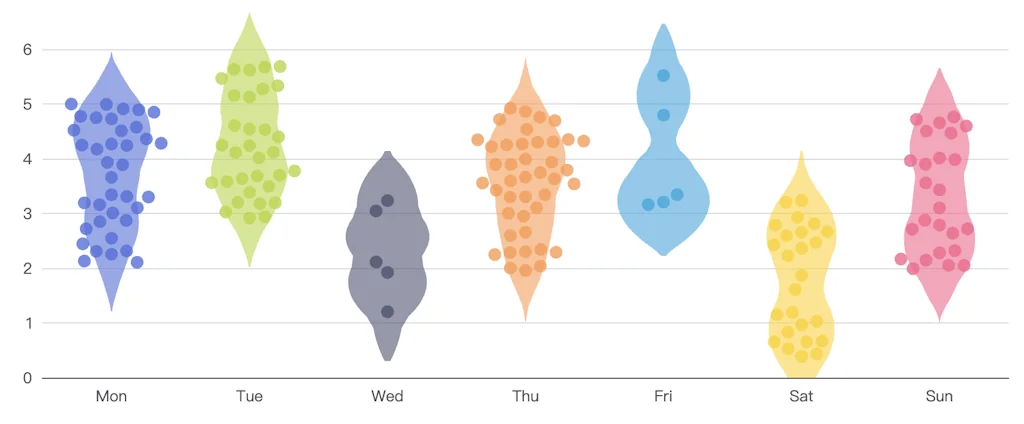
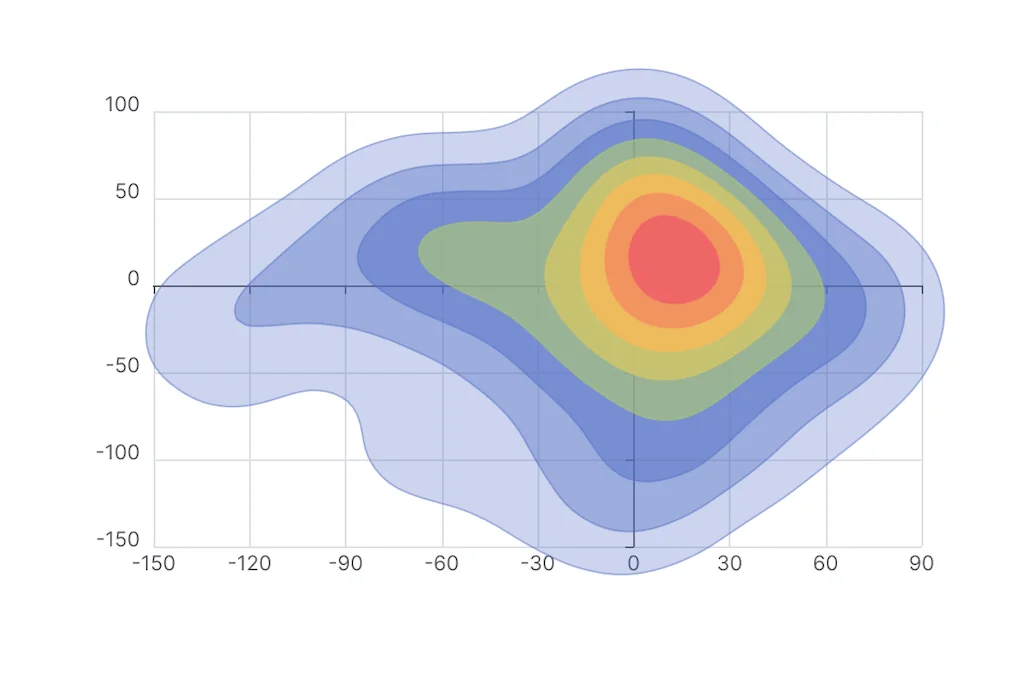
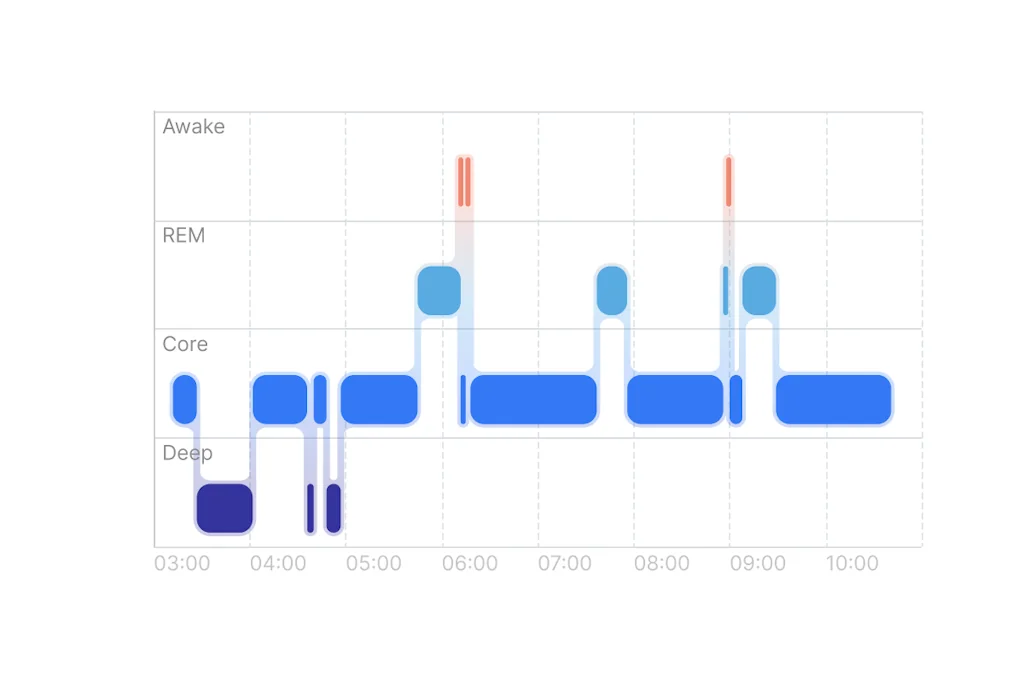
Luck nudged me into the ECharts orbit nearly ten years ago as a fresh intern. Today I speak not just as a user, but as a ten-year contributor and someone who grew up alongside Apache ECharts. ECharts was first open-sourced on GitHub in 2013. What began as an internal charting library quietly slipped into the wild, polished by engineers who simply wanted better charts for everyone. By 2015 I was an intern on the team, fixing tiny bugs, then dreaming bigger. My first love letter to the project was the liquid-fill chart—water that rises like hope in a glass. In that moment I realized code can be poetry; data, story. In 2018 we ferried ECharts across an ocean and offered it to the Apache Software Foundation. Two years later it graduated. During incubation we learned that healthy software is not built by heroes but by habits—clear governance, welcoming docs, and the grace to let people leave and return without drama. Last month we shipped ECharts 6.0.0. Beneath the calm surface: a new default theme that feels confident, modern, and versatile. Responsive dark-mode that listens to your OS. Chord charts, swarm charts, jittering scatter charts, enhanced stock charts, broken axes, and a matrix coordinate system that lets any chart nest inside any other. We turned custom series into truly registerable components ready to reuse. Yet the code is only half the story. The heart of ECharts beats in its people: midnight reviewers, weekend contributors, students sending their first pull request and greeted like old friends. In every design debate we argue more about architecture than features, because—as my mentor once said—“adding a feature is the easiest part.” That sentence still walks beside me, reminding me that the kindest thing we can build is room for the next idea. If you need to turn numbers into meaning, come stand with us. The water is still rising, and there is always space for one more ripple.
Apache ECharts has been around for 12 years. But with version 6.0, it feels completely new again. This release comes with a ton of new features — from layout improvements to better theming, AI integration, and more. But if I had to choose just one favorite, it would be the freedom of composition. Even in its early days, ECharts was known for its powerful customization and extensibility. I’ve seen developers use it to create stunning visualizations — even something as wild as a Hogwarts Castle. But deep customization used to take time and effort. Now, with 6.0, it’s much easier to build exactly what you want — faster, and with fewer limitations. It’s a real upgrade for anyone who wants to tell clear, expressive stories with data. Another highlight is the completely redesigned theme color system. The new look is clean, modern, and professional — your charts just look better, straight out of the box. Apache ECharts 6.0 also brings something exciting for the AI community. They’ve open-sourced ECharts MCP, which allows large language models to directly generate beautiful, high-quality charts. It’s a forward-thinking move, and I can’t wait to see what comes next at the intersection of visualization and AI. There’s a lot more under the hood, and I’m sure developers will keep discovering new gems in this version. Personally, I’m really looking forward to what the community builds — I expect to see some truly impressive visual work. And finally, a big shoutout to the amazing team behind this release: 100pah, plainheart, sz-p, konrad-amtenbrink, Lruler, Justin-ZS, jqqin, joakimono, tassosgeo, mortalYoung, seaheart, SihongShen, ribeirompl, mustcanbedo, andrearoota, robin-gerling, lzl0304, souhailaS, SchnWalter, jbampton, and shaymolcho (list from GitHub) — thank you. This is open-source at its finest. And last but not least — to Ovilia, who gave everything for Apache ECharts 6.0 — you're a legend.
From real-time dashboards to story-telling infographics, Apache ECharts 6 turns complex data into intuitive, interactive visuals—faster, smoother, and more beautifully than any other library I’ve tried.
It's been years since I'm using Apache ECharts in several projects. Never disappointed with quality, robustness and amazing support form community.
切换主题的功能太棒了。还有就是希望加一些对原生的react或vue的组件支持 文档能支持深色模式就更好了
Frequently Asked Questions about Apache ECharts 6.0
When did Apache ECharts 6.0 become popular?
Apache ECharts 6.0 became popular around August 7, 2025.
What are the main advantages of using Apache ECharts 6.0?
The top advantages of Apache ECharts 6.0 include: expanded chart types, professional visuals, community support, free, open source.
What are the disadvantages of Apache ECharts 6.0?
Some reported disadvantages of Apache ECharts 6.0 include: lack of native React or Vue components.
What is Apache ECharts 6.0's overall user rating?
Apache ECharts 6.0 has an overall rating of 5.0/5 based on 9 user reviews.
What type of tool is Apache ECharts 6.0?
Apache ECharts 6.0 belongs to the following categories: Engineering & Development, Data analysis tools, Data visualization tools.
Related Engineering & Development Tools
MakerKit
The Next.js SaaS Boilerplate to launch a SaaS in record time
Bugsee
Bug and crash reporting for iOS and Android
React Native
A framework for building native apps using React
YepCode
Developer-first AI integrations: build, run, scale safely
Depot
Build Docker containers up to 20x faster
TablePlus
Database management made easy
Related Data analysis tools Tools
SQLify
Query all your apps and APIs using SQL
Metabase
Open source Business Intelligence and Embedded Analytics.
jobdataapi.com
Simple Job Data API
mcbroken
Is the McDonald's ice cream machine broken?
Viable
Use feedback to drive product innovation & customer growth
SheetBot AI
AI Data Analyst that can save hours of your work
Related Data visualization tools Tools
Observable
Build and host better data apps, dashboards, and reports.
DashGPT
Turn Spreadsheets Into Interactive Dashboards
Analytics Pack
A curated directory of the best startup metrics
TalktoData AI
Data analytics made easy with AI
ChartFast
Get your own AI Data Analyst to do your data work.
Params Editor for Chromium Browsers
Edit URL Query Parameters with Smart Input Types
Compare Apache ECharts 6.0 :
Don't Get Fooled by Fake Social Media Videos
The world's first fact checker for social media. Paste any link and get an instant credibility score with sources.
Try FactCheckTool Free