
Grafana
Beautiful metric & analytic dashboards
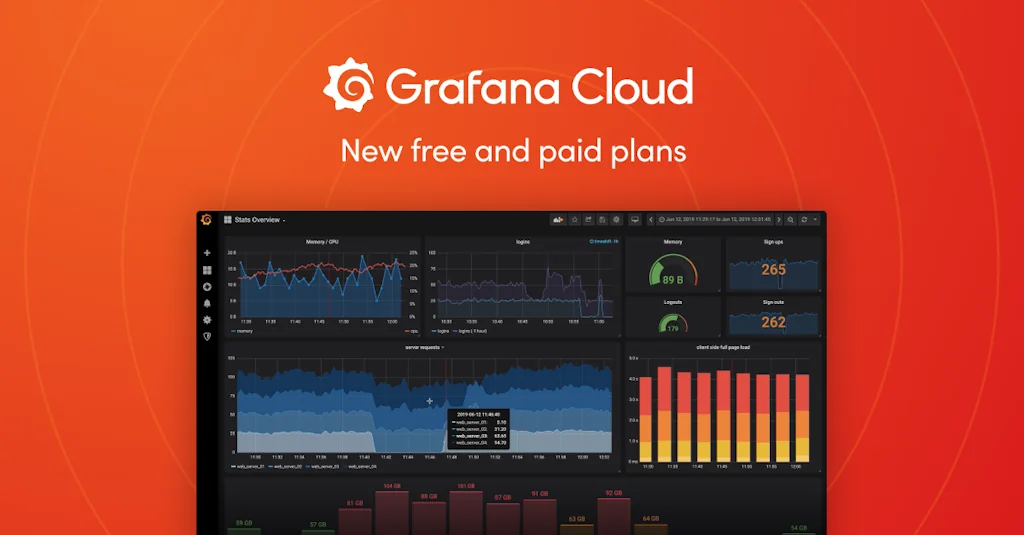
What is Grafana?
Grafana is the open source analytics & monitoring solution for every database
Pros & Cons
Pros
- Flexible dashboards
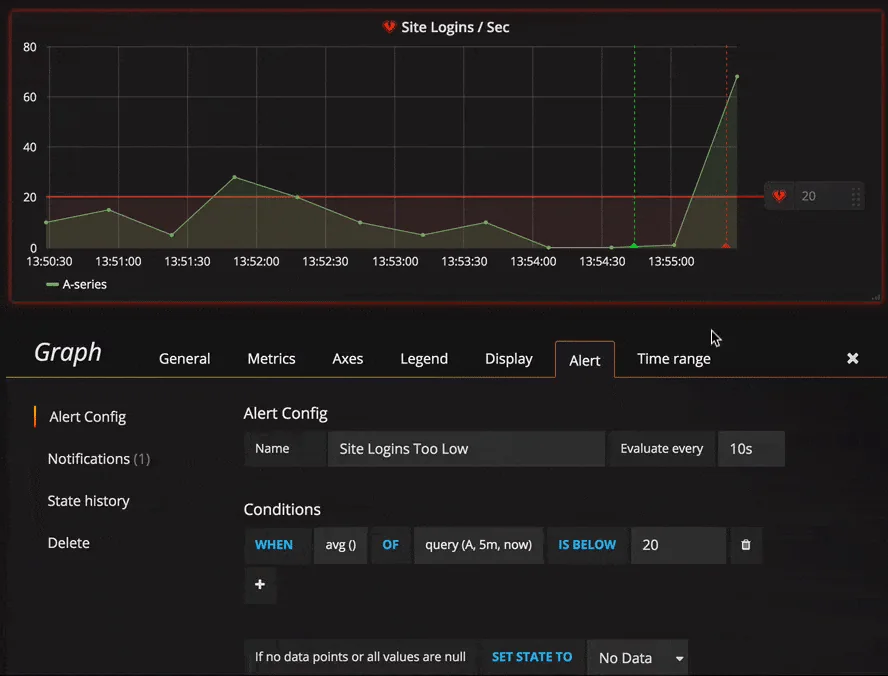
- Real-time monitoring
- System performance tracking
Cons
- Complex setup
Tool Details
| Categories | Issue tracking software, Data analysis tools, Data visualization tools, Observability tools |
|---|---|
| Website | grafana.com |
| Added | June 7, 2017 |
| Platforms | Web |
| Social | Twitter · Facebook · GitHub |
Recent Reviews (8)
The go-to dashboard for observability. We use it for real-time monitoring of agent reasoning, tool use, and feedback. Clear, customizable, and the fastest way to surface insights.
It gives us powerful, customizable visualization tools to monitor and analyze our data in real-time, making it easier to track and improve our systems' performance.
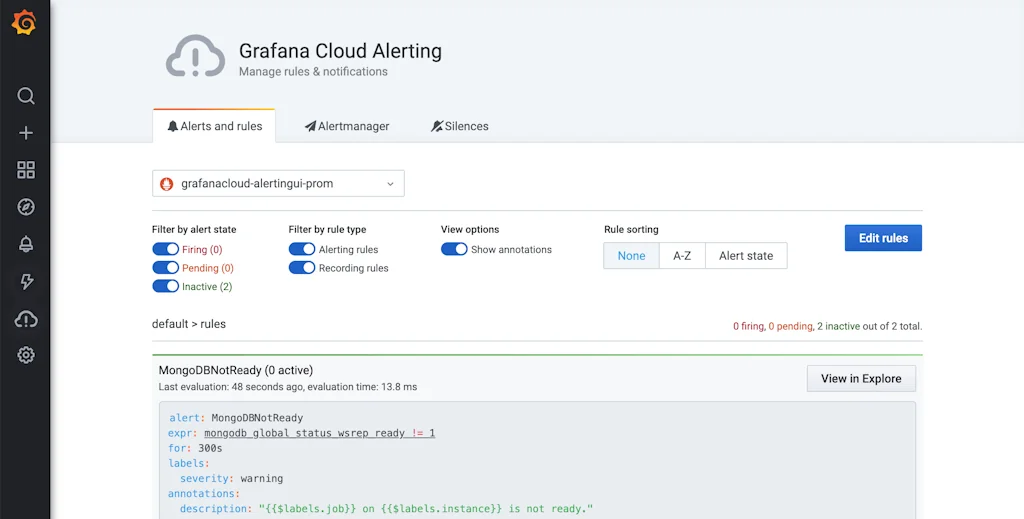
We use Grafana Loki to track logs and traces across our system. It’s a huge part of how we made observability seamless.
Grafana is an amazing tool that has made my life much easier when it comes to working with data. Its flexibility and ease of use allow me to easily create beautiful dashboards that help me and my team quickly understand and analyze data. I especially appreciate the ability to integrate with various data sources, allowing me to gather all the necessary information in one place. With Grafana, I feel more confident in monitoring and analyzing data, and it really helps improve the efficiency of my work.
Grafana shows teams and companies what their users really do, not just what they say they do. These are known as revealed behaviors. Users aren’t very adept at predicting their own futures. Having analytics allows tech teams to dig deeper than human-error-prone surveys and monitoring. Grafana makes that data useful again by integrating all data sources into one single organized view
Grafana has been great for helping my team and me monitor system performance in real time. I use it to track key metrics and quickly spot issues. The dashboards are flexible and powerful. It took a bit to learn at first, but now it's a core part of our workflow.
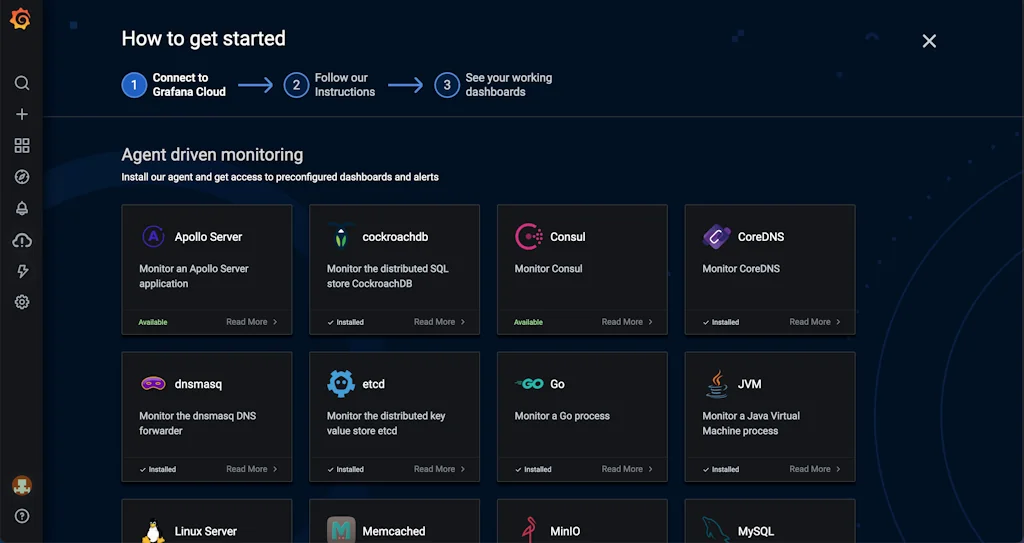
I’m not a metrics pro, but Grafana helped me track site performance with almost zero setup. The prebuilt dashboard templates saved me hours, though I wish there was more guidance for beginners like me.
One of the best free monitoring tool. The stack is really great!
Frequently Asked Questions about Grafana
When did Grafana become popular?
Grafana became popular around June 7, 2017.
What are the main advantages of using Grafana?
The top advantages of Grafana include: flexible dashboards, real-time monitoring, system performance tracking.
What are the disadvantages of Grafana?
Some reported disadvantages of Grafana include: complex setup.
What is Grafana's overall user rating?
Grafana has an overall rating of 4.9/5 based on 17 user reviews.
What type of tool is Grafana?
Grafana belongs to the following categories: Issue tracking software, Data analysis tools, Data visualization tools, Observability tools.
Related Issue tracking software Tools
IssueHunt
An issue-based bounty platform for open-source projects.
Kener
Self-hosted status page with batteries
Codegiant
Software Development Tool
Logaflow
Perfect tool for collecting user feedback and debugging
QA Compass
Master your bug reports
morningmate
All-in-one workspace where work flows and teams align
Related Data analysis tools Tools
DataGems
Unlock the stories hidden in your marketing data
Vetted AI
A product search engine that helps people be savvy shoppers.
Gilion
Forecast your future, fund your future
Notionlytics
Advanced analytics for Notion pages
Apache ECharts 6.0
Rank #1 Free Charting-library on GitHub with 20+ Chart types
Diffshop
#1 #1 Product Research, Trend Discovery and Adspy Tool
Related Data visualization tools Tools
Scale
Get human tasks done with just one line of code.
Vizzly
Customer-Facing Analytics for Modern SaaS
PDF Charts
Charts for Busy Developers!
DataSquirrel.ai
Data Analytics and BI for Non-Tech Managers
Translucent: Spatial Web Apps
Bring websites into your space — visionOS
SheetBot AI
AI Data Analyst that can save hours of your work
Related Observability tools Tools
Trufflow
Map how software gets used across teams
Logsy
Setup log streaming in 3 seconds
VoltAgent: OpenSource AI Agent Framework
Build TS AI agents with n8n-style observability
Oh Dear!
Oh Dear! monitors your entire website,not just the homepage.
Zipy
Debug Web & Mobile apps with AI, Session Replays & more
Pulse for Elasticsearch and OpenSearch
The World-Class Cluster Support and Optimization Platform
Compare Grafana :
Don't Get Fooled by Fake Social Media Videos
The world's first fact checker for social media. Paste any link and get an instant credibility score with sources.
Try FactCheckTool Free